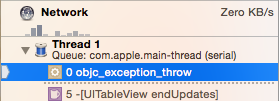
There are a lot of tools in Xcode that help us during the debugging process. No doubt. Breakpoints for example are these tiny signals that tell the debugger to temporarily suspend execution of program at a certain point. My favourite type of breakpoints are the exceptional ones. Exceptional breakpoint is this guardian that pauses the execution of our program, as soon as it knows that things are going to be pretty bad. When this happens, we are usually presented with all the stack trace and in the blink of an eye we know what happened that was bad. This is the usual scenario.
But sometimes we see things like that:
1
| |
Which with tells us literally nothing, when we are not familiar enough with the code that we are working. We get sterile error message that tells us that we are doing something wrong with UITableView animations, but it’s all we get out of the box.
However, there is a way to get more detailed info. The thing that we can do to know the issue of our crash is this:

- Go do debug navigator
- Select
objc_exception_throwframe - Go to console
- Type in:
po $eaxwhen using simulator orpo $r0when debugging on a device.

This way you get more detailed error description which tells you a lot more about the place that you should be looking for to find your mistake.